Electricity Mix in CA GREET

Life Cycle Associates submitted the following comment concerning the Electricity Mix in CA GREET for CARB’s Board Hearing on February 19, 2015, which considers the re-adoption of a revised Low Carbon Fuel Standard:

Life Cycle Associates would like to provide insight to the choice of electricity mix in CA_GREET. The choice of electricity mix affects the consumed power for fuel production facilities as well as exported power. Both input power and export power are treated symmetrically in the GREET model. Exported power is treated as a co-product using the substitution method.

The question of electricity mix is most important for fuel pathways using or exporting the most electricity. The pathways involving the most power and the amount of power used/exported are shown below.

Fuel pathways using or exporting the most electricity

These pathways use/export the most power of any fuel pathway. The export power from cellulosic ethanol and sugarcane ethanol represent 13.4% of the output product, while the power is 100% and 150% of the input for the electricity and hydrogen pathways. In contrast, the 0.55 kWh/gal of corn ethanol represents only 2.4% of the energy in this pathway. Consequently, understanding the environmental impact of the power in the above 4 pathways is of the highest priority.

Purpose of LCA

The objective of the LCA for the LCFS is to identify the impact of the change to the use of an alternative fuel on global emissions. ARB has embraced this objective in the analysis of indirect land use. The consequential impact of biofuel use reflects the net global impact of feedstock demand on the agricultural system. ARB calculates the marginal land use for each biofuel.

Similarly, ARB has embraced the marginal approach in the estimation of emissions from alternative fuels, specifically electric vehicles (Unnasch 2001) and hydrogen vehicles (Unnasch, 2005). The analysis conducted as part of ARB fuel cycle studies and the California Hydrogen Highway Blueprint Plan concluded that the marginal resource for electric power corresponds to permanent and sustainable load growth. This concept has the following implications:

  • Average emissions are not an appropriate indicator of future emissions
  • Minute by minute dispatch does not predict permanent changes in resource mix
  • Nuclear power is always base loaded and never on the margin
  • Marginal power in California is best represented by a mix of new combined cycle natural gas power plants and non-fossil renewables that correspond to the Renewable Portfolio Standard Requirement.

This approach for marginal emissions was applied to the California Energy Commission’s AB1007 Full Fuel Cycle Analysis (Unnasch, 2007), which resulted in the first GREET model used to represent California specific emission impacts. The inputs for this model provided that basis for CA_GREET 1.8b.

Marginal Resources Mix

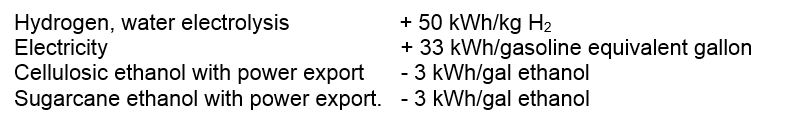
The choice of marginal resource mix has remained challenging. For example the Midwest mix used on CA_GREET 1.8b was based on a Midwest mix without nuclear power. Unfortunately, the changes in the power market with the grown in natural gas is more complicated. ARB has chosen to use and average resource mix for all regions in the US and globally. This approach simplifies the selection of electric resource mix in that the method is well defined. Unfortunately the average resource approach does not accurately reflect the impact on the environment for the fuels with the greatest electric power impacts. These include EV’s charged in California as well as cellulosic ethanol and sugarcane ethanol from Brazil. Since these fuel pathways use the most electric power, ARB should develop a marginal approach for these pathways. As more information is understood in other regions, a marginal resource mix could be applied as the analysis progresses.

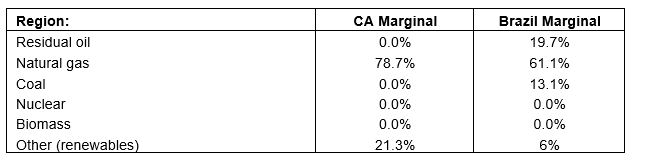
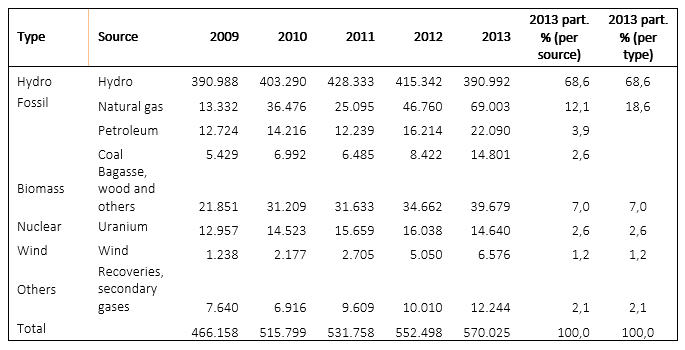
Table 1 shows the marginal resource mix for California and Brazil, which are the regions affected most by the power assumption. The prior CA_GREET1.8b assumption on marginal power is appropriate. Alternatively, ARB could revise the marginal assumption to correspond to the prevailing RPS requirement. Similarly, the Brazilian marginal mix can be calculated from the annual resource mix in Table 2. Clearly fossil fuels are growing on the margin and hydroelectric and nuclear power do not correspond to resource growth.

Table 1. Marginal resource mix for fuel pathways involving the most electric power.

Marginal resource mix for fuel pathways involving the most electric power

In the Brazilian situation, bagasse power is derived from the sugarcane ethanol plants, so this power that is being produced by the plant should not be treated as the power that is displaced by the ethanol plant.

Table 2. Generation Resources in Brazil

Generation Resources in Brazil

The choice of average power for California does not accurately affect the criteria pollutant impacts. Criteria pollutants shown in the Appendix include many generation resources that are not on the margin, providing the incorrect impression that EV and hydrogen vehicle emissions are higher than they actually are.

Therefore, the most appropriate resource mix for Brazil and California would be marginal resources defined in here.